After starting your pitch with a simple description of the problem and solution, you have to convince investors there’s a big market for it. This is particularly true for specialized or technical products where investors have no sense of the scale of the problem or even who the intended customers are.
Of all the slides on your deck, market size usually gets the least scrutiny. It’s background information to give investors a sense of the scale of the opportunity. The key is to keep it reasonable; don’t exaggerate or you’ll lose credibility. And keep it focused on the market for your specific product, not some humongous market where your product is part of only one tiny segment.
In theory, market sizing is simple. If you’re building a better mousetrap, add up the sales of all the mousetraps on the market now, or find data from a reputable source. But, of course, it’s rarely that easy. If you’re building something completely new, there’s no market for it now so you’ll need to find another way to estimate the potential demand.
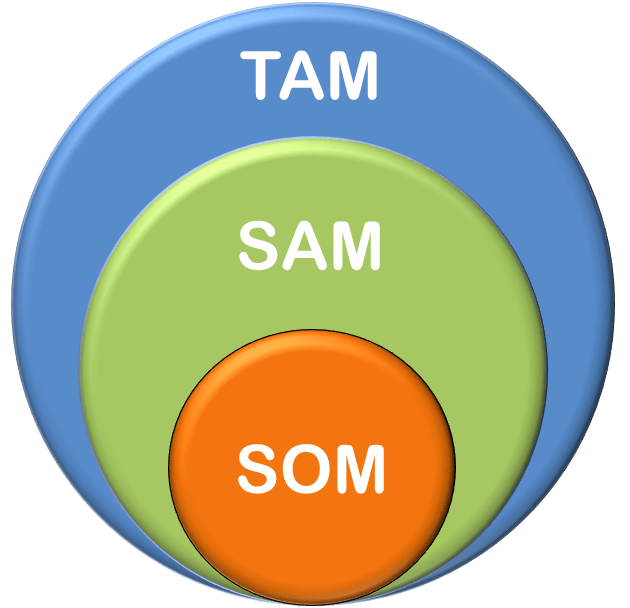
The common approach to presenting market sizing is TAM, SAM, and SOM. Personally, I’m not enamored of the T/S/S paradigm, but it is the standard way of discussing market sizing so whether you use it in your pitch or not, make sure you understand it and are prepared to answer questions about your T/S/S.
Understanding TAM, SAM, SOM
TAM (Total Addressable Market): This is the total market size for your product. It is not the total market in which your product is one component. Let’s say you’ve developed a better tracking system for solar panels to follow the sun during the day. Your TAM is the total market for solar trackers. It’s not the market for solar panels, solar systems, or anything except solar trackers. Even if they’re a critical component of the $52B market for solar energy, that doesn’t tell me whether the market for your component—solar trackers—is $10 million or $10 billion.
SAM (Service Addressable Market): This is your sub-segment. Looking at our solar tracker again, there are various types of solar trackers optimized for different uses. If you’ve developed a one-axis tracker optimized for utility-scale solar farms built on hilly ground, then your SAM is the total market for one-axis trackers for utility-scale solar farms on hilly ground. SAM also considers your geographical reach. If China represents half the market but you don’t expect to be able to sell your product in China, then you need to remove it from your SAM. The SAM should be the actual addressable market for your product. It may be a challenge to estimate, but this is the important number.
SOM (Service Obtainable Market): This is your realistic market share. For a solar tracker in a specialized subsegment, if your product is better, it’s conceivable you’ll capture 100% of the SAM. If you’re building a restaurant chain, that’s not going to happen. If you’re building a network simulator, the number of companies that could benefit from your product huge, but realistically, the number that will buy one is small. The SOM is then a realistic assessment of how much revenue you can conceivably generate if you saturate the opportunity.
What’s Wrong with T/S/S?
TAM, SAM, SOM is a great paradigm to break down the market and at a glance, provide a useful view of your market to potential investors. So what’s wrong? For an academic exercise, it’s perfect. For the real world with real products, especially new products, the data rarely exists. So instead of giving one wild estimate of market potential, you’re forced to generate three.
For all the business plans I’ve personally developed over the years, I’ve never once had a clear TAM, much less the subsegment breakdowns needed to estimate the SAM and SOM. Admittedly, I’ve worked exclusively on niche B2B products, but most entrepreneurs have expressed similar frustrations, and most pitches I see present some humongous market for which data does exist as their TAM, which tells me nothing.
If the T/S/S paradigm works for you, great. I’m happy to see a T/S/S diagram. If it doesn’t, ditch it. In the end, as an investor, all I really care about is the total potential revenue for your product. Any way you can put that into dollars is fine by me. Which means you still need some sort of market size estimate. So let’s look at ways to estimate it.
Estimating Market Size
If you can’t find market data from reputable reports, there’s a few ways to calculate (guess) your market size.
Top down: Start with whatever data you can find on the larger market and work your way down to your subsegment. Let’s say you’re building a new developer tool. You can guess the total number of developers based on the number of github and bitbucket accounts. That’s a great starting point, but if you’re making a paid product for enterprise use, then you need to weed out all the student accounts, duplicate accounts, and abandoned accounts to get to the number of enterprise developers. Then you need to guess at the percentage of developers who would benefit from your product, and a reasonable estimate of how many work at a company willing to pay for developer tools. That’s a lot of assumptions, but it hopefully gets you to the right order of magnitude. Top down works best for large, diffuse markets.
Bottom up: I expect to be able to sell my product to Company A for $100,000. How many similar companies have the same problem? If there’s a hundred, then the simplest estimate of market size is $10M. I can start from there and adjust as needed based on company size, pricing flexibility, etc. Bottom up works best when selling to a small, specialized base of customers.
Competitor analysis: Add up the sales of all the existing competitors and you have the current market size. That’s easy but rarely possible. Sometimes there may be one or two market leaders that release public information on their sales, and you can combine that with an estimate of their market share to determine the total market size. Competitor analysis works best with niche products where the market dynamics are well known.
Proxy market: This is my favorite. Find other products sold to the same customers. If you can find sales data for other products, it can give you a starting point to estimate your revenues. Proxies can be complementary products that customers would use together with your product, or they may be something completely unrelated but used by the same group of people. Be creative as you think about your users and the various products and tools they use over the course of the day.
Money or time savings: Many products, particularly for B2B use, promise to save customers time or money compared to existing alternatives. You should be able to capture a fraction of those savings. For example, if your tool saves developers 10% of their time and the total cost of all enterprise software development is $1 trillion, then at least in theory, your potential market is $100 billion. That simple analysis alone is sufficient for your pitch as long as you explain that what you’re presenting is the total benefit to customers rather than your specific market size.
Which of these should you use? Start with whichever is simplest. In most cases, it’s simplest because it takes the fewest steps and least number of wild guesses to get from the data available to an estimate of market size. But don’t stop there. Try the other approaches, too, and make sure they generate similar numbers. If not, question your assumptions and adjust until the results of the different estimates converge. Then you’ll be able to discuss your market size with confidence.
Subscribe to receive your weekly insights
